Statistics
Overview
Statistics is the page where you can visually analyze API usage per endpoint. It shows summary cards (total calls, success, failed, response time), a daily call volume chart, collaboration key breakdown, and more — all on a single screen.
Sandbox and production environments aggregate statistics independently, so you can clearly separate test calls from live operation calls.
How to get here
- Top menu Stats → Select an endpoint from the list
Endpoint list
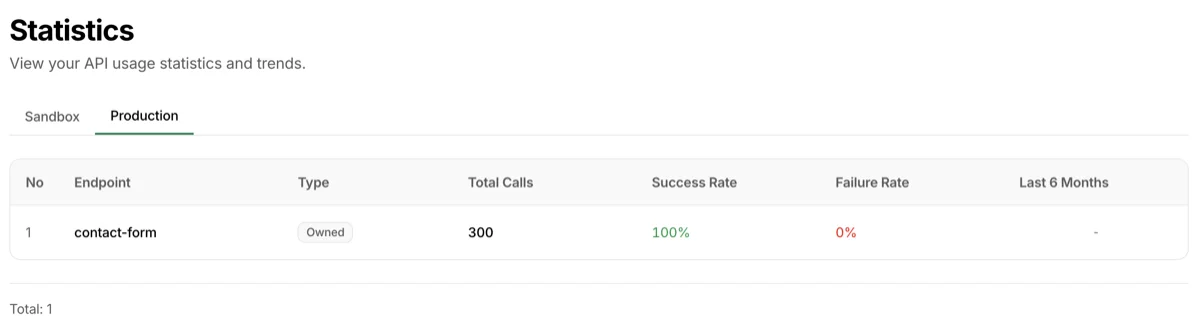
When you open the Stats page, the endpoint list appears first. It summarizes the latest statistics for each endpoint.
Use the Sandbox | Production tabs at the top to switch between environments.
| Column | Description |
|---|---|
| Endpoint | Endpoint name |
| Type | Owned if you created the endpoint, Shared if you're participating as a collaborator |
| Total calls | Total API calls for this endpoint |
| Success rate | Percentage of successful calls |
| Failure rate | Percentage of failed calls |
| Avg response | API average response time (ms) |
| Last 6 months | Mini chart showing monthly call volume trend |
Click an endpoint to go to its detailed statistics page.
Monthly statistics
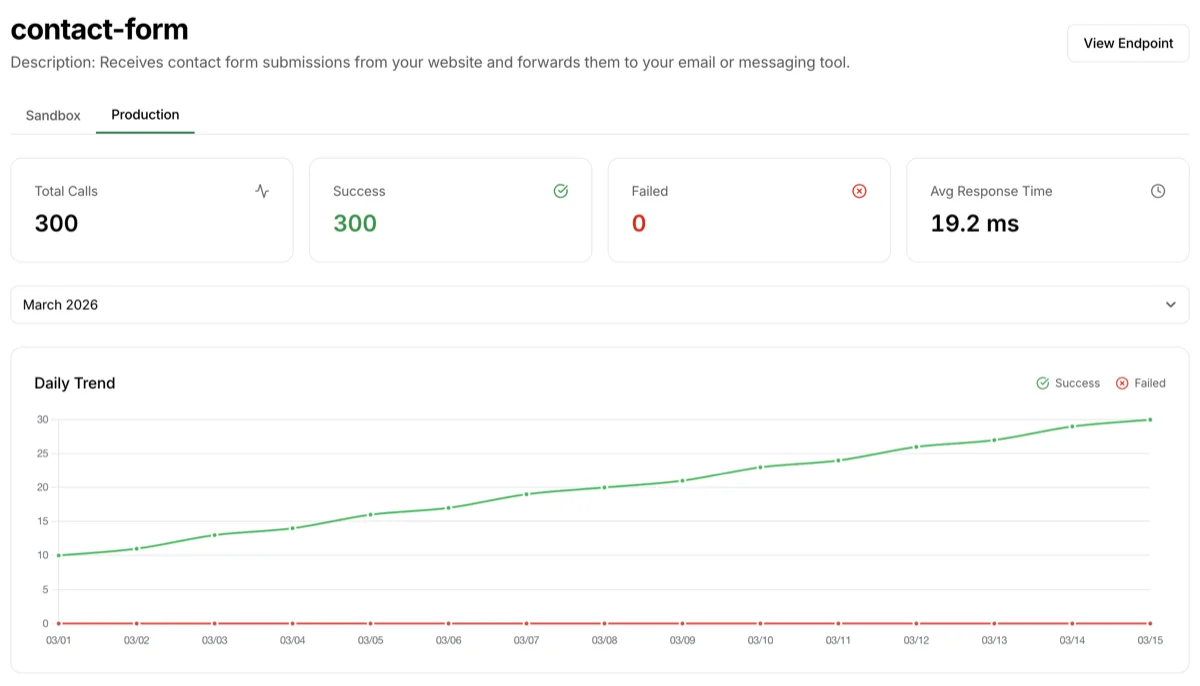
Selecting an endpoint opens the monthly statistics view.
Header area
- Endpoint name and description
- Sandbox | Production environment tabs — View statistics per environment independently
- Month selector dropdown — Choose the month to view (default: current month)
Four summary cards
| Card | Content |
|---|---|
| Total calls | Total API calls for the selected month (success + failure) |
| Success | Number of successful calls |
| Failed | Number of failed calls |
| Avg response time | API average response time (ms). CUD (Create/Update/Delete) weighted average |
Daily call volume chart
Below the summary cards, a bar chart shows daily call volume changes for the selected month. Success (green) and failure (red) are displayed together in a single chart, so you can track quality trends at a glance.
Collaboration key breakdown
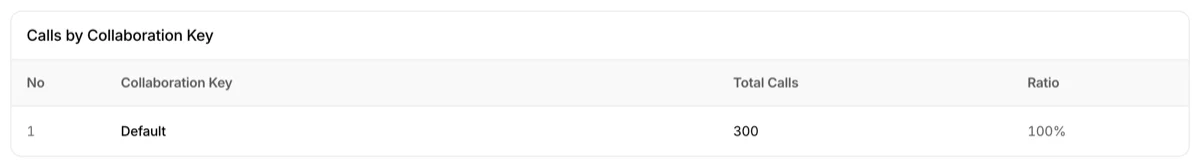
Shows which collaboration keys made how many calls during the selected month as ratios.
| Column | Description |
|---|---|
| Collaboration key | Name of the collaboration key used (default if none) |
| Calls | Total call count for this collaboration key |
| Ratio | Percentage of the total (%) |
When you've issued collaboration keys to multiple partners, you can quickly see who's calling the most, or which partners aren't calling at all.
Daily trend
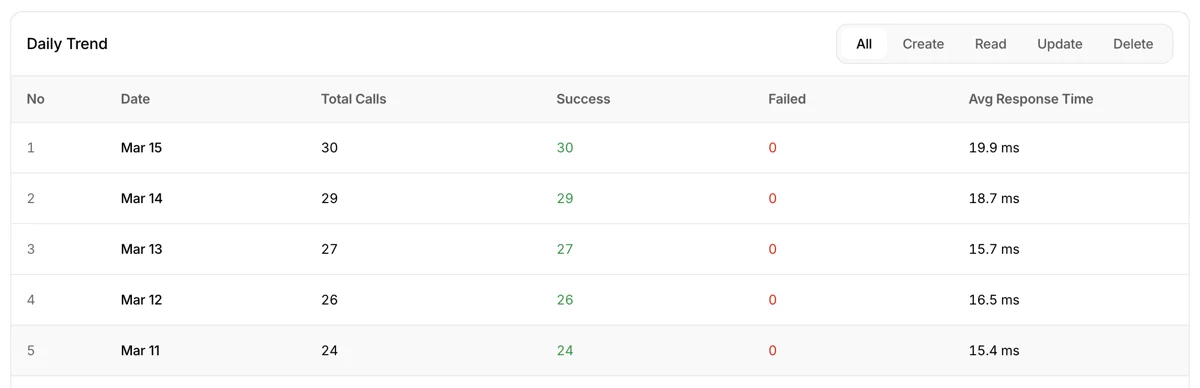
Shows the daily call history for the selected month in a detailed table. Useful when you want to check the same data as the chart above, but in numbers.
Method filter
A method filter is available at the top of the table, so you can extract a specific operation.
All/Create/Read/Update/Delete- When a filter is selected, only the success/failure counts for that method are shown
Columns
| Column | Description |
|---|---|
| No | Row number |
| Date | The date |
| Total calls | Total calls for the date (success + failure) |
| Success | Success count (green) |
| Failed | Failure count (red) |
| Avg response time | API average response time for the date (ms) |
Troubleshooting
- Statistics are empty: Statistics are only aggregated when API calls come into that environment. If you've only called in sandbox, check the Sandbox tab. If you've called after production deployment, check the Production tab
- I just made a call but the numbers don't go up: Statistics are aggregated in batches after queue processing, so they may not reflect instantly. Refresh after a short while
- Collaboration key ratios don't add up to 100%: Rounding differences can make the total 99% or 101%. The actual aggregation is accurate
- Read response time isn't shown: Average response time is calculated as a weighted average of CUD (Create/Update/Delete) only. GET requests are synchronous, so they're not part of this statistic