Dashboard
Overview
The dashboard is the home screen you see right after logging in. It summarizes your active endpoints, today's API call volume, this month's plan usage, and the most recent activity — all on a single page.
You can click any card or follow the links at the bottom to jump directly to the detail pages.
How to get here
- Shown immediately after login
- Click Dashboard at the top of the left menu
- Click the header logo
New Endpoint button

Click New Endpoint in the upper-right corner to go to the endpoint creation page. For detailed instructions, see the Create New Endpoint guide.
Summary cards
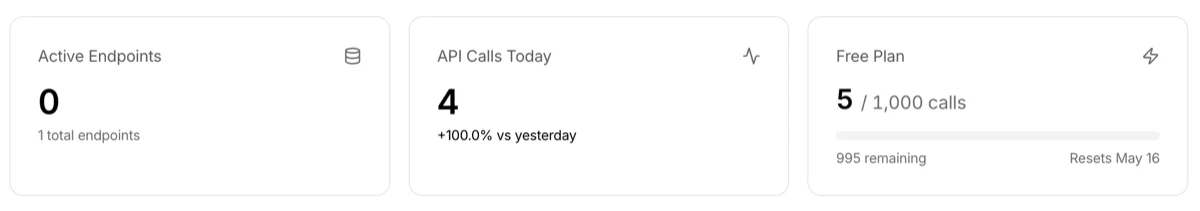
Active Endpoints
- The main number shows production-deployed active endpoints
- Below it, "X total endpoints" includes inactive and sandbox-only endpoints
- If you're participating as a collaborator on other endpoints, a separate link appears
API Calls Today
- Total API calls accumulated from midnight today
- Shows the percentage change compared to the same time yesterday
Plan
- Current plan name and this month's usage percentage
- A progress bar visually shows consumption against the monthly limit
- Changes to warning color above 80%, danger color above 100%
Recent Activity
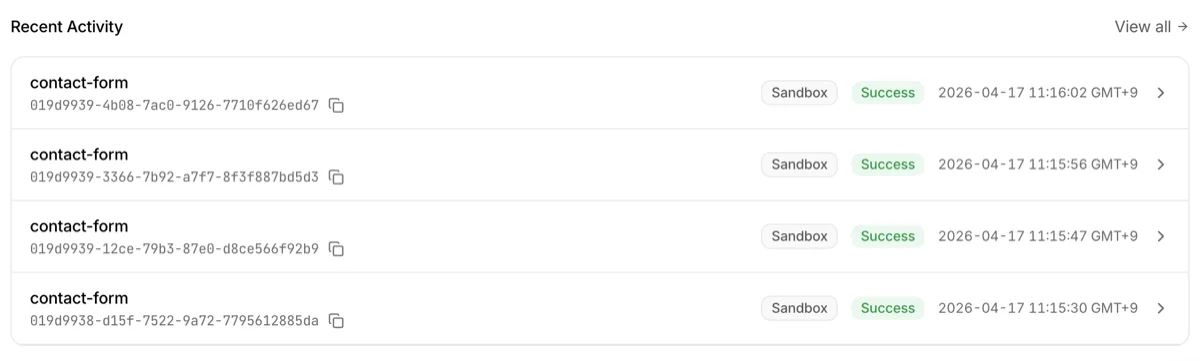
A section to quickly scan recent API call records.
| Column | Description |
|---|---|
| Endpoint name | The endpoint that received the call |
| ID | Request identifier. Copy button available |
| Environment | Sandbox / Production badge + Config version |
| Status | Success · Failed · Pending |
| Time | Relative time (e.g., "2 min ago") |
To see all records, click the View all logs link at the bottom.
Quick Links
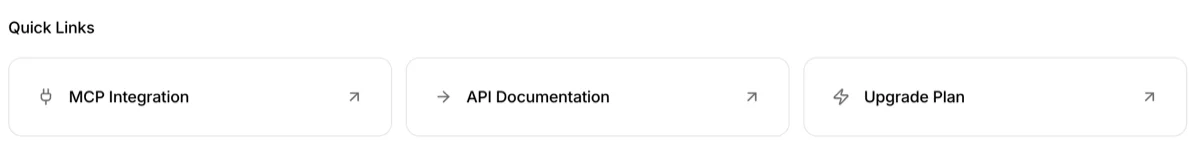
At the bottom of the dashboard, there are 3 quick link cards for frequently used features.
- AI Integration — Go to AI tool (ChatGPT, Claude, Cursor, etc.) integration settings
- API Documentation — Go to the developer docs hub (
/docs) - Upgrade Plan — Go to the subscription page
Alert banners
Depending on your account status, alert banners may automatically appear at the top of the dashboard. They disappear automatically once the condition is resolved.
Usage 80% warning

Shown when this month's API calls reach 80% of your plan limit. Calls are still allowed, but this is a heads-up that the limit is approaching. Consider reviewing your plan upgrade options if needed.
Usage limit exceeded

Shown when this month's API calls exceed 100% of the plan limit. On Basic/Pro plans, additional calls are blocked. On Enterprise plans, overage billing applies.
Collaborator invitation
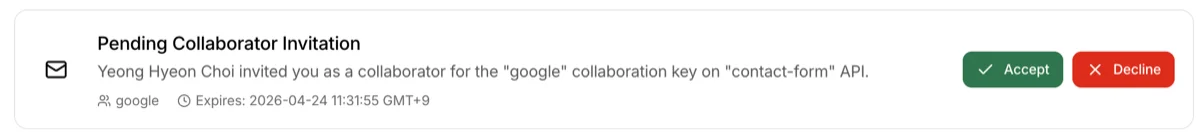
Shown when another owner has invited you as a collaborator. You can accept or decline directly from the banner. The same invitation notification is also sent via email, so you won't miss it even if you don't visit the dashboard often.
Production deployment request

Shown when a collaborator has requested production deployment for an endpoint you own. Click the banner to go to the endpoint detail page and decide on the deployment. This notification is also sent via email.
Troubleshooting
- Active Endpoints shows 0: The main number only counts production-deployed active endpoints. If you're still in the sandbox stage, 0 is normal — check the "X total" number below for all endpoints
- API Calls Today shows 0: Before production deployment, production calls are not counted. Sandbox calls are shown normally
- Collaborator endpoints are missing: If you haven't accepted the invitation yet, accept it from the collaborator invitation banner at the top