Logs
Overview
Logs is the page where you can view all API call records for an endpoint in one place. You can check request success/failure, sent payloads, webhook delivery status, and error messages.
Sandbox and production environments are separated into tabs, so you can track test calls and live operation calls independently.
How to get here
- Top menu Logs → Select an endpoint from the list
- View Logs link in the right sidebar of endpoint detail
Endpoint list
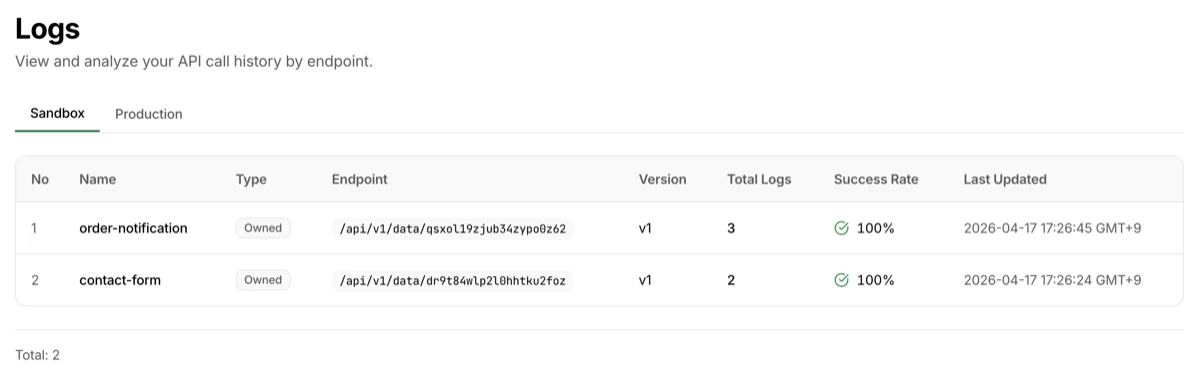
When you first open the Logs page, you see the endpoint list. It summarizes log status per endpoint.
| Column | Description |
|---|---|
| Endpoint | Endpoint name |
| Total logs | Total call count for this endpoint |
| Success rate | Percentage of successful calls |
| Last activity | Most recent call time (relative) |
Click an endpoint to go to its detailed logs page.
Detail page header
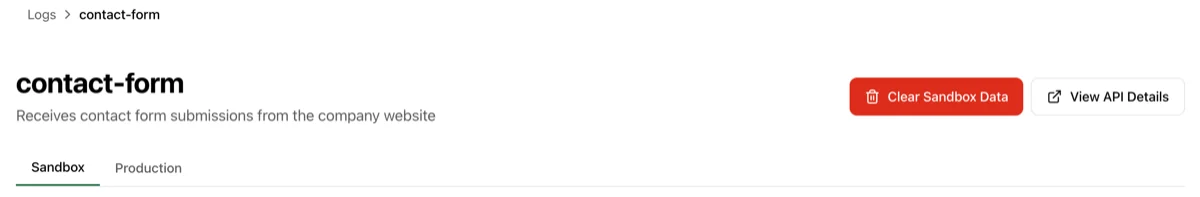
When you select an endpoint, the following elements appear at the top.
- Endpoint name and description
View API Detailsbutton — Go to the Endpoint Detail pageClear Sandbox Databutton — Permanently delete sandbox call records and usage statistics for this endpoint- When accessed by a collaborator, it appears as
Clear My Sandbox Dataand only deletes records generated by them - Does not affect production data
- When accessed by a collaborator, it appears as
- Sandbox | Production environment tabs — View logs for each environment independently (Learn more about environment tabs)
Search filters
The search area has two tabs: Period Search and Field Search.
Period Search
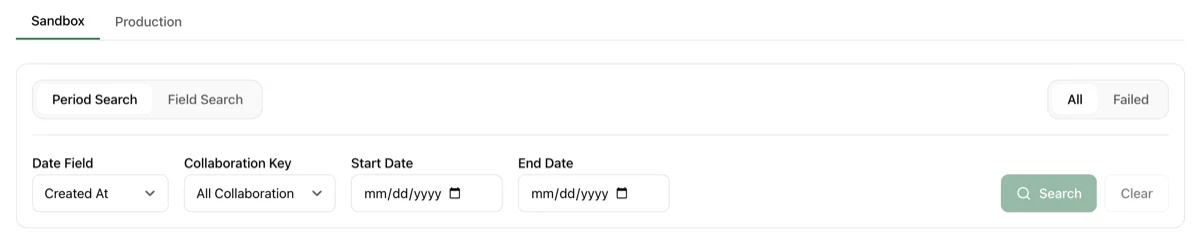
Filter logs by time range and status.
- Date basis — Choose
Processed atorCreated at. Default is Processed at - Start / End date — Specify the time range
- Status — Choose
All/Success/Failed - Collaboration key —
Allor a specific collaboration key (shows only calls made with that key)
Field Search
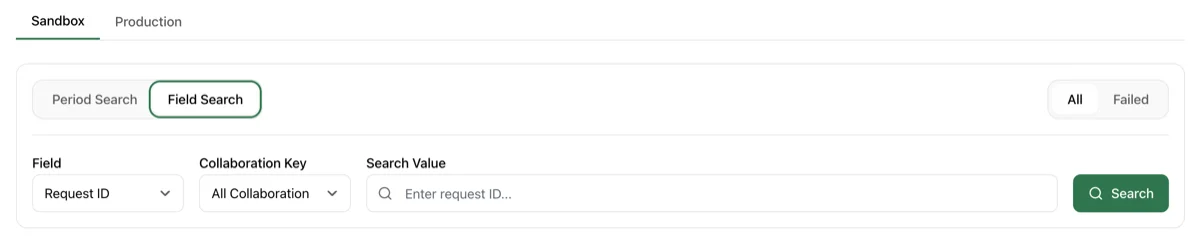
Use this when you want to find logs by a specific value.
- Field selection:
Record ID— Exact match by record ID (prefix match supported)Content search— Substring match (case-insensitive) anywhere across the full payload, minimum 3 characters
- Enter Search value and execute
- When
Content searchis selected, Start / End date inputs appear. If dates are not specified, it searches within the last 30 days by default
How content search works (and its limits)
- Search scope: Substring match against the entire payload (the JSON document) serialized as text
- Multilingual: Works for Korean, English, Japanese/Chinese characters, etc. (English is case-insensitive)
- Numbers are searchable but match as substrings: e.g.,
"32"matchesage:32as well as132,321, and any other text containing32 - JSON keys are also indexed: searching common key names like
"name"or"address"will match every record — use more specific terms - Not supported: comparison operators (
>,<,=), exact-value match, field-scoped queries
Log list
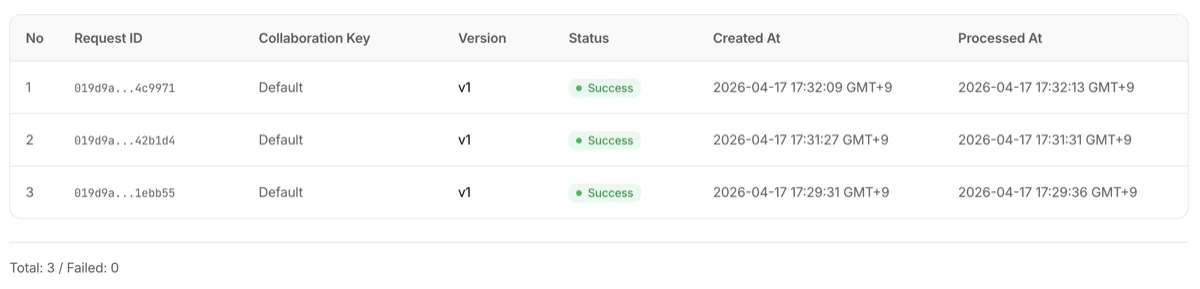
Below the search filters, the endpoint's call history is displayed in a table.
| Column | Description |
|---|---|
| Record ID | Record identifier |
| Status | Success · Failed · Pending badge |
| Collaboration key | Collaboration key used for this call (or default if none) |
| Created | API call reception time |
| Processed | Storage and webhook processing completion time |
Click any row to go to the log detail page.
Log detail page
Overview
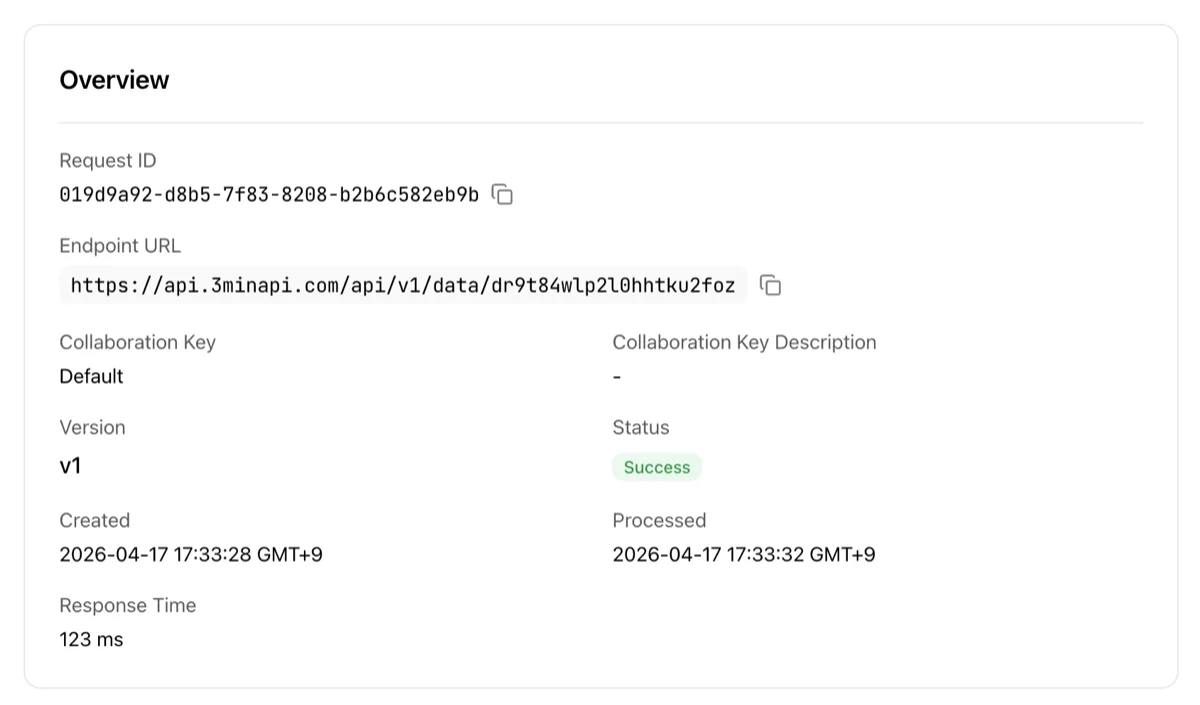
Shows detailed information for an individual call.
- Record ID: Unique record identifier
- Endpoint: The endpoint that received the call
- Version: Configuration version at the time of the call
- Processed: Storage and webhook processing completion time
- Response time: Gateway processing time (ms)
- Collaboration key: The collaboration key name and description used (if applicable)
- Error message / Error details: For failed calls, error type, status code, field errors, and occurrence time
View Endpointbutton — Go to this endpoint's detail page
Payload
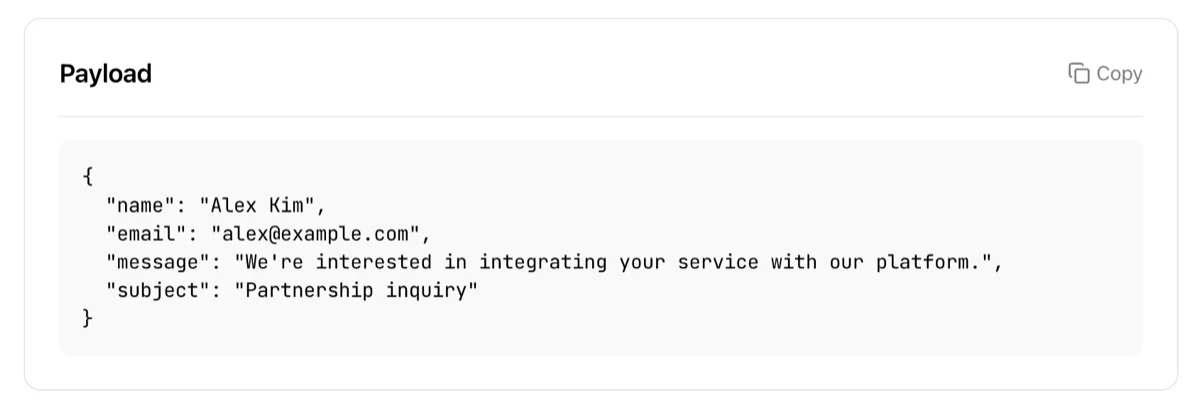
Shows the original JSON data sent with the API call.
For production, an additional backup archive file is generated after 30 days and can be downloaded from Dashboard > Archives for bulk export.
Danger Zone
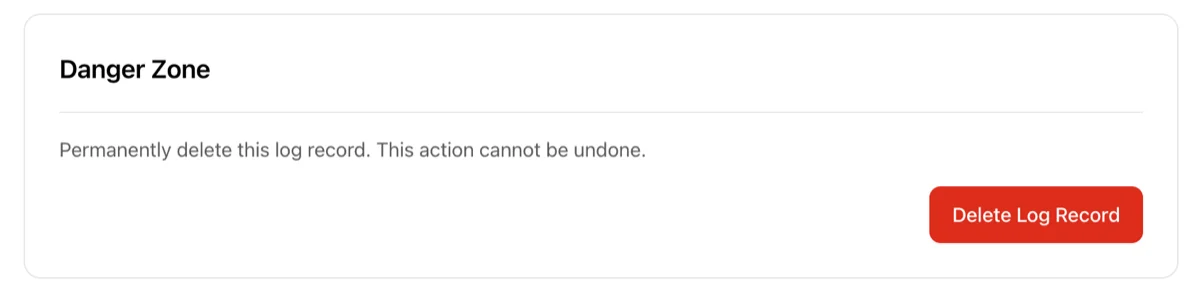
- Delete log record — Permanently removes this log record
- The record itself and its associated payload are deleted. This cannot be undone
- Usage statistics are not affected
View Endpoint quick link
The right side of the detail page shows a quick link card to jump to the endpoint detail page for the current log. You can quickly check the endpoint's settings, webhooks, collaboration keys, and more.
Troubleshooting
- Logs are empty: The Production tab shows no records until production deployment. Check that test calls are being recorded on the Sandbox tab first
- Search returns no results: Either your search term is under 3 characters or no records match within the date range. (1) Try a shorter or more specific term (a 2–3 character Korean word, or part of an English word), and (2) widen the date range to within 30 days. The old "searchable fields" setup step has been removed — no per-field configuration is required.
- Want to see calls from only a specific collaborator: Select the collaboration key from the Collaboration key dropdown in the Period Search tab
- Can sandbox clear be undone?: No. Cleared sandbox call records and statistics are permanently deleted. Use with caution